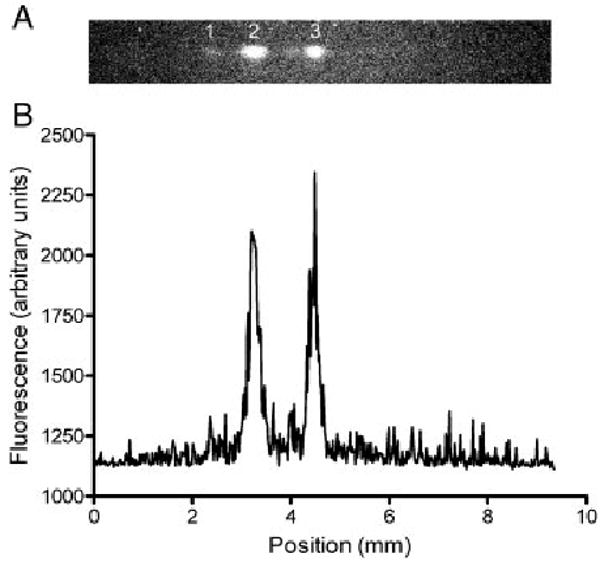
Figure 1.

(A) Image of a μFFE separation of rhodamine 123 (1), rhodamine 110 (2), and fluorescein (3). (B) A linescan of the same μFFE separation. The separation voltage was 50 V (anode on the right) and the buffer flow rate was 0.375 mL/min. The concentration of all analytes was 10 nM.
