
Figure 2.
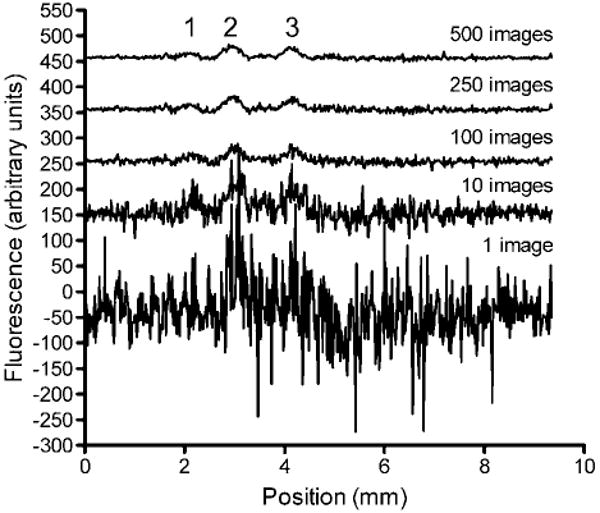
Effect of averaging multiple linescans on S/N in a μFFE separation of 2 nM rhodamine 123 (1), 500 pM rhodamine 110 (2), and 500 pM fluorescein (3). The exposure time for a single image was 100 ms. The time between subsequent images was 240 ms. Linescans have been offset for clarity.