
Figure 3.
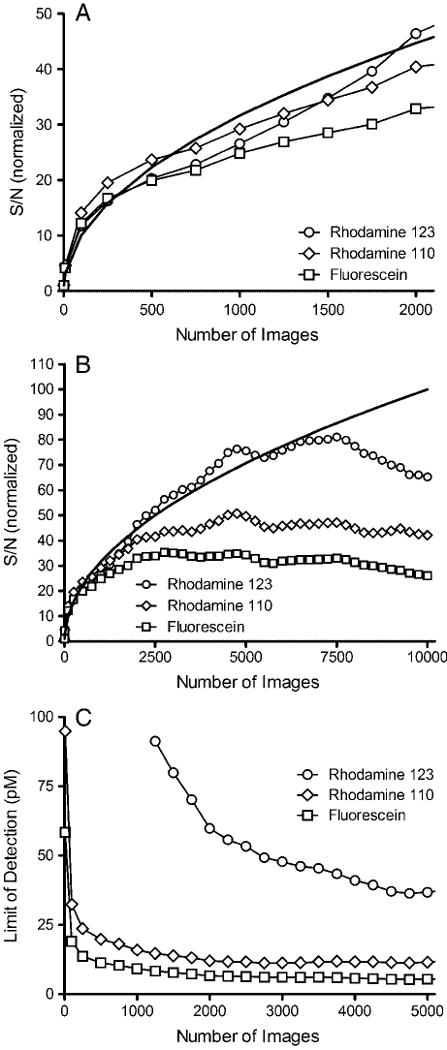
Effect of number of images averaged on the improvement in S/N (A and B) and LOD (C) in a μFFE separation of 2 nM rhodamine 123 (circles), 500 pM rhodamine 110 (diamonds), and 500 pM fluorescein (squares). The data in (A) and (B) have been normalized to the S/N observed in a single image for each analyte. The solid lines in (A) and (B) show the theoretical curves where S/N is proportional to n1/2.