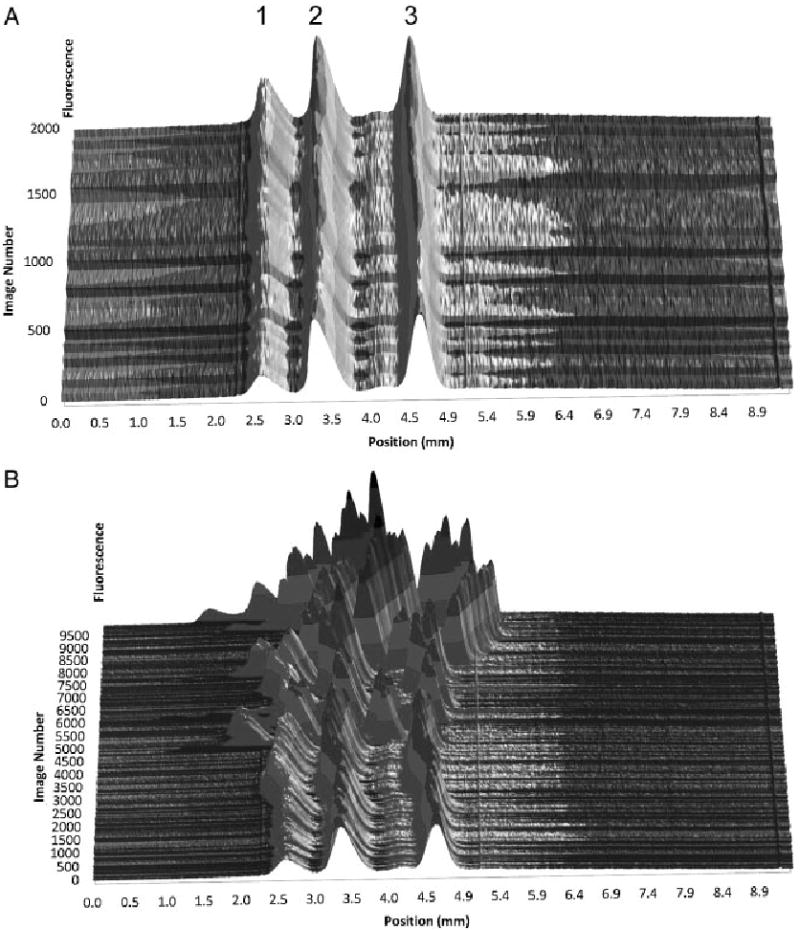
Figure 4.

A stacked plot of linescans demonstrating peak position stability over time of a μFFE separation of 50 nM rhodamine 123 (1), rhodamine 110 (2), and fluorescein (3). Sets of 50 subsequent linescans were grouped and averaged before they were plotted to improve S/N. As shown in (A) peak position is stable up to approximately 2000 images (8 min collection time). Over the longer separation times shown in (B) peak position becomes erratic due to formation of electrolysis products at the electrodes.
