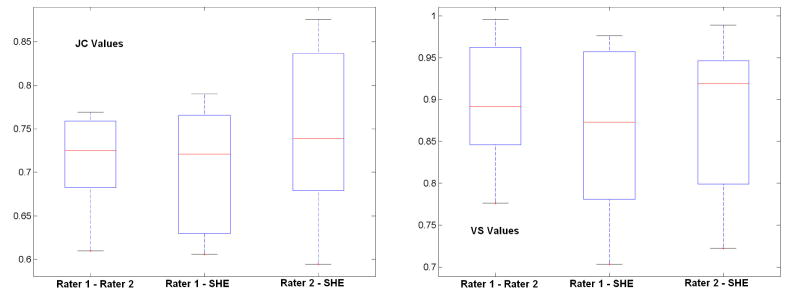
Figure 9.
Similarity of segmentation results between semi-automated results by different raters and the automated results for non-enhanced tumor. “Rater 1 – Rater 2” represents the similarity between two semi-automated results of two raters, “Rater 1 - SHE” represents the similarity between semi-automated results by rater 1 and automated results; “Rater 2 - SHE” is the similarity between semi-automated results by rater 2 and the automated results.

