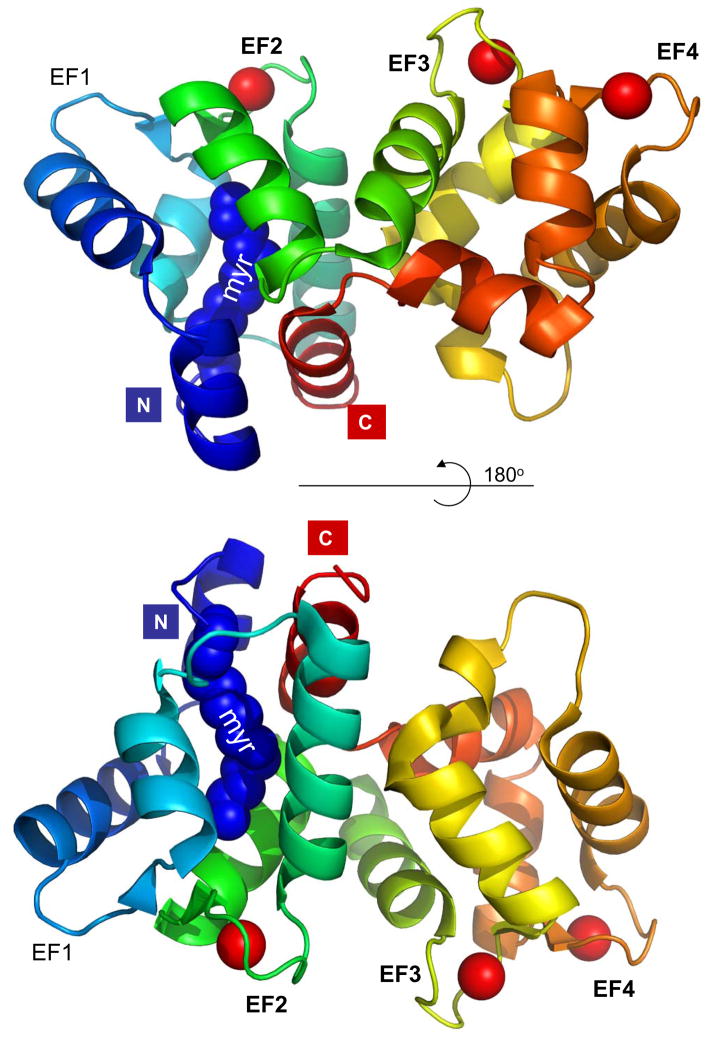
Figure 1.
Structure of Ca2+-bound, myristoylated GCAP1 (pdb 2R2I, generated in pymol). Helices are coded in rainbow colors; Ca2+ is represented by red balls. The EF-hand loops are identified by EF1–4. ‘myr’ denotes the N-terminal myristoyl group buried between the C-terminal (green) and the N-terminal helix (blue). The N- and C-terminal ends are indicated with colored boxes.

