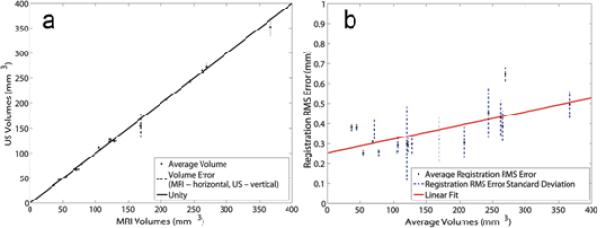
Figure 4.
Results from US-MRI Registration. Panel A: In order to reduce inter-observer variation, boundaries were assessed and volumes for each image set for each modality. The `·' shows the average volume calculated from both investigators and both modalities while the dashed lines (horizontal is MRI and vertical is US) show the error associated with the volume for the respective modality. The data points fit the line of unity with an r = 0.9997 (y = 0.9808x + 1.8441). Panel B: Average registration RMS error (·) and the associated standard deviations (dashed lines) are plotted versus average volume. The linear fit (solid line) shows an upward trend with increasing volume (y = 0.0007x + 0.2546, r = 0.657).

