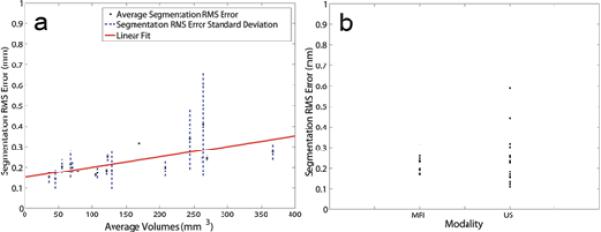
Figure 5.
Results from US-MRI Segmentation. Panel A: Average segmentation RMS error (·) and the associated standard deviations (dashed lines) are plotted versus average volume. The linear fit (solid line) shows a similar increasing trend with increasing volume (y = 0.0005x + 0.1499, r = 0.680). Panel B: RMS segmentation error is plotted for each modality, depicting a larger variability with segmentation in US than MRI.

