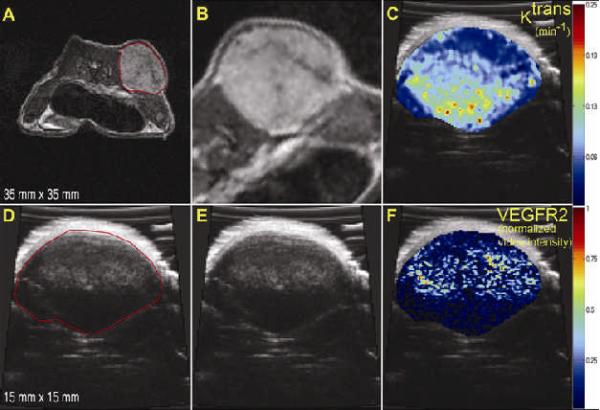
Figure 6.
Step by step demonstration of the registration between parametric maps produced by MRI and US. Panels a and d illustrate the segmentation of the tumor from both MRI (A) and US (D). Once the image sets have been registered (panels B and E), transformations are applied to the maps of Ktrans and VEGFR2 from the respective modalities. The maps can then be compared on a voxel by voxel basis (panels C and F).

