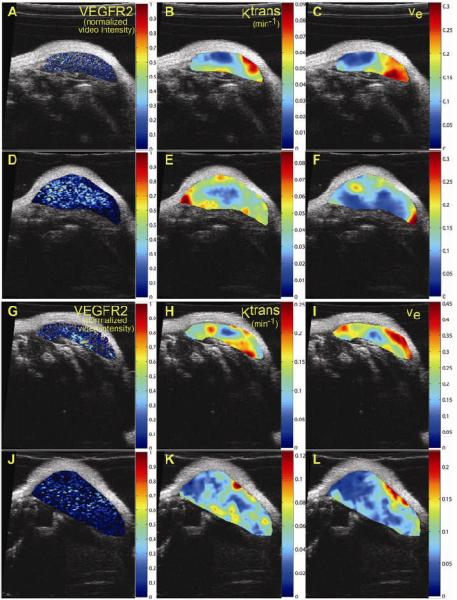
Figure 7.
Parametric maps of VEGFR2 distribution, Ktrans, and ve for two mice at two time points. Panels A and D and panels G and J show the VEGFR2 distributions for mouse 1 and mouse 4, respectively at both time point while B, E, H, K demonstrate the Ktrans maps. ve maps are presented in panels C, F, I, and L. While a spatial correlation between VEGFR2 and ve maps was not expected, correlation between VEGFR2 and Ktrans was anticipated; however, both visual and quantitative analysis show that there does not appear to be any significant correlation between these two metrics.

