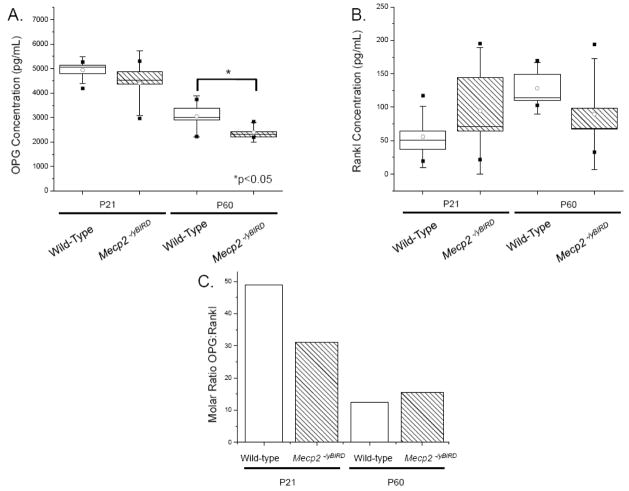
Figure 6. OPG levels were in excess of Rankl at P21 and P60.
Duplicate samples of blood serum (n≥6) were assayed by ELISA to determine the concentration of A) OPG and B) Rankl in wild-type and Mecp2−/yBIRD mice. Statistical box plot analyses show a range of 25–75%, with the white circle depicting the mean of each group of samples. SD is shown by the whiskers and the high and low values for each set of samples are indicated by [■]. White boxes represent wild-type samples and hatched boxes indicate Mecp2−/yBIRD samples. C) Molar ratios of using the median of OPG and Rankl for each group was calculated and depicted on the graph. White columns represent wild-type samples and hatched white columns indicate Mecp2−/yBIRD samples, Significance was noted * if p<0.05.

