
Figure 2.
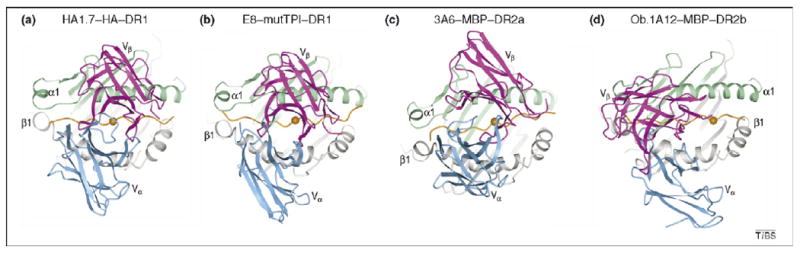
Comparison of human TCR–peptide–MHC class II complexes. The structures show the range of docking topologies observed for MHC class II-restricted TCR. (a) Top view of the anti-microbial HA1.7–HA–DR1 complex. Colors of TCR, MHC and peptide are the same as in Figure 1. The central P5 residue of the peptide is shown as an orange sphere. (b) The anti-tumor E8–mutTPI–DR1 complex (Protein Database Accession No. 2IAM). (c) The autoimmune 3A6–MBP–DR2a complex (Protein Database Accession No. 1ZGL). (d) The autoimmune Ob.1A12–MBP–DR2b complex.