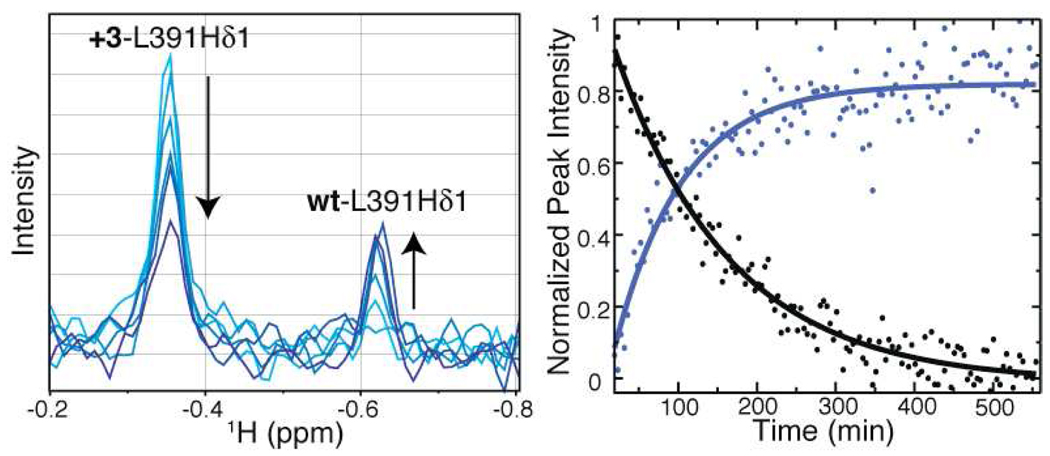
Figure 1.
Monitoring the rates of interconversion for ARNT PAS-B Y456T. Left: Peak intensity changes in 1D 1H NMR spectra are recorded as the protein re-establishes equilibrium (t=0 min, light blue; t=500 min, dark blue), as monitored by L391Hδ1. Right: Kinetic traces for the interconversion, corresponding to peak intensity changes for the wt (blue) and +3 (black) conformations.

