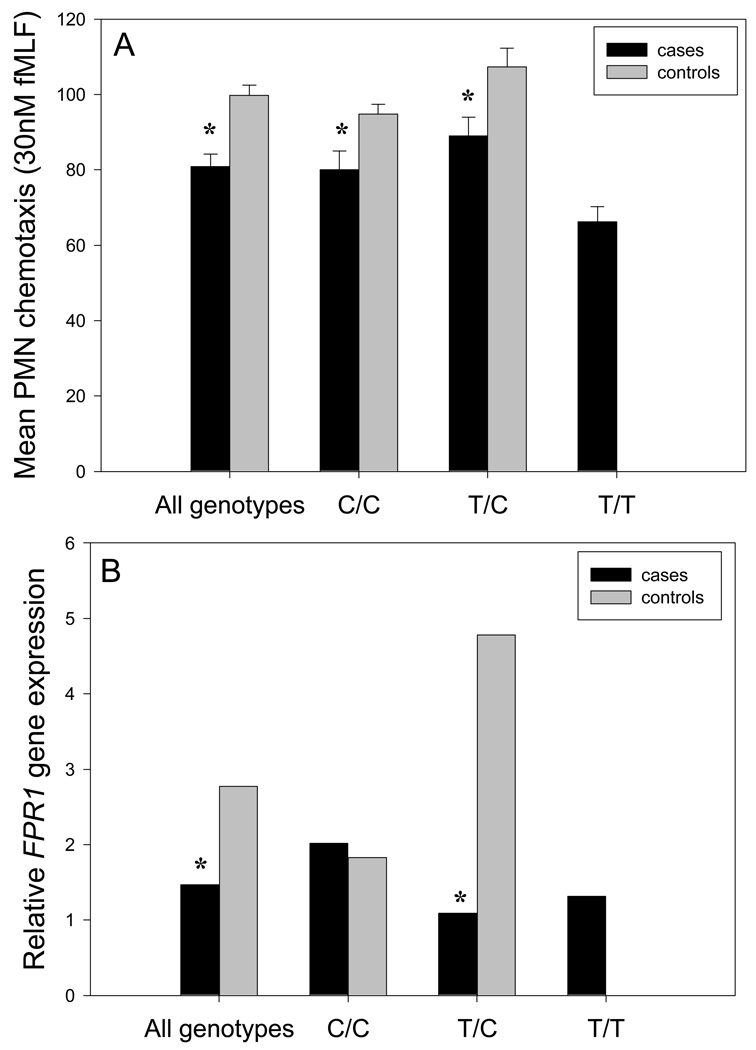
Figure 1.
Relationship of 348T>C genotype to PMN chemotaxis activity and PMN FPR1 expression. Statistically significant differences between cases and controls are denoted by * (P < 0.05, t test). Upper panel: Chemotaxis activity was assayed in the presence of 30 nM fMLF with PMNs obtained from 26 case subjects and 32 controls. Data are presented as mean ± SEM. Lower panel: FPR1 expression was assayed with RNA isolated from 26 case and 37 control subjects. Transformed values (ΔΔCt) represent n-fold change in FPR1 expression relative to baseline. Since the transformation skews the variation within samples, error bars were not included.

