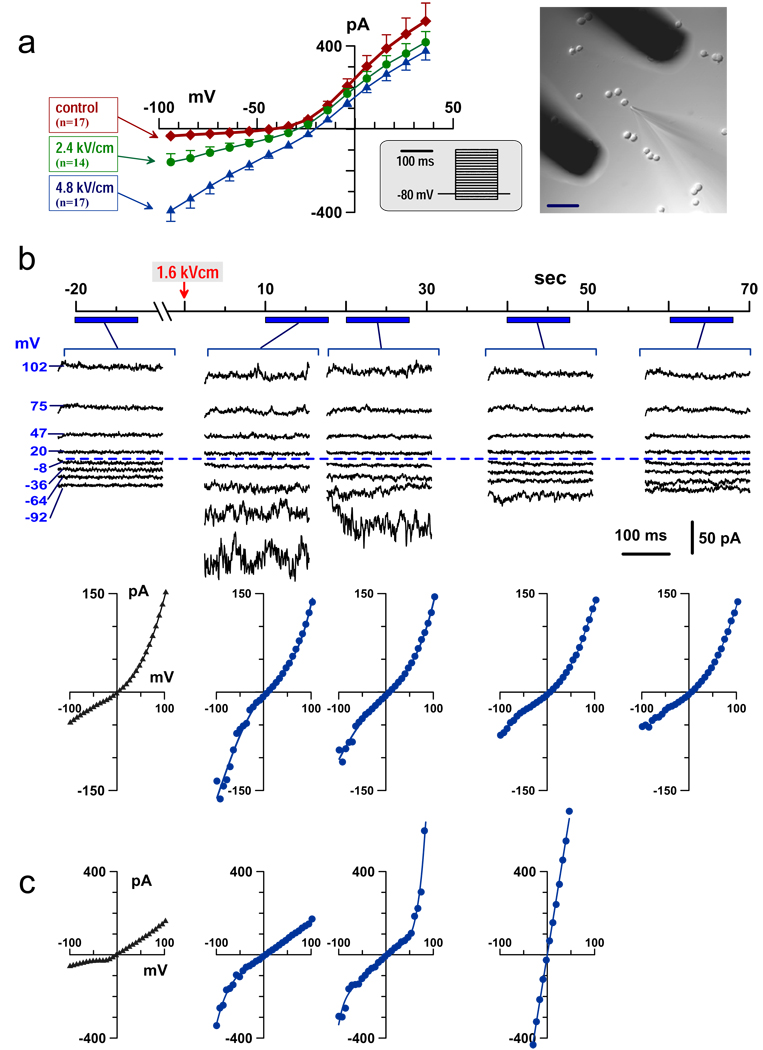
Fig. 1.
Inward rectification of the whole-cell current in nsEP-treated GH3 cells. (a) Effect of nsEP applied to intact cells (before attaching the recording pipette). Currents were measured in 100–140 sec after nsEP. Shown are mean values ± SE for n independent, randomized experiments. Insets show the voltage step protocol and the position of nsEP-delivering electrodes relative to the exposed cell and the recording pipette. Calibration bar: 50 µm. (b, c) Effect of nsEP under symmetrical solution conditions; cells were dialyzed with pipette solution prior to nsEP. The timeline applies to both (b) and (c); nsEP was applied at 0 sec (arrow). Currents were repeatedly probed by a voltage step protocol during intervals indicated under the timeline. Shown are both the original current traces and corresponding current-voltage (I–V) plots (b), or I–V-plots only (c). Dashed line identifies zero current. Nanopores either gradually resealed (b), or broke into highly conductive, non-rectifying pores (c).

