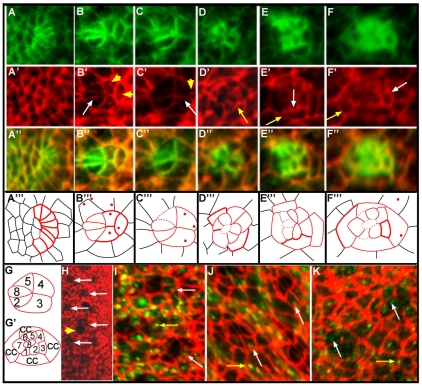
Fig. 2.
Ed localization is dynamic throughout rotation. (A-F‴) Anti-Arm (A-F, green) and anti-Ed (A′-F′, red) staining, and merge (A″-F″), in sequentially older ommatidial precursors in Drosophila third instar eye disc. Corresponding schematics (A‴-F‴) are shown with Ed localization in ommatidial precursors represented by solid red lines, Ed localization in cells outside the ommatidial precursors shown in black, and dashed red lines indicating cell boundaries where Ed is below detectable levels. The intensity of Ed staining correlates with the line weight. (A-A‴) In row 1, Ed is localized in all cells. (B-B‴) By row 3, Ed levels have diminished in R8, R2 and R5 (white arrow). Ed puncta are visible (yellow arrowheads). (C-C‴) Just prior to the start of rotation, Ed levels drop in the photoreceptor cells (see also H); Ed is visible at the R3/R4 (white arrow), R2/R3 and R4/R5 interfaces and in puncta (yellow arrowhead). (D-D‴) Ed levels increase in the photoreceptors as rotation progresses (yellow arrow). (E-E‴) In row 8, Ed remains high in the photoreceptor and cone cells (white arrow), and levels equalize between rotating and non-rotating cells (yellow arrow). (F-F‴) At the completion of rotation, Ed is enriched at the cone cell/interommatidial cell (IOC) (yellow arrow) and the cone cell/photoreceptor cell (white arrow) boundaries. (G,G′) Key to the schematics in A‴-F‴. cc, cone cell. (H) Low-magnification image of an eye disc stained with anti-Ed antibody. Just before rotation begins, ommatidia with low levels of Ed appear as `holes' in the staining pattern (white arrows). Mitotic cells, which also resemble `holes' (yellow arrowhead), are distinct. (I,J) Ed (red) vesicles colocalize with (I) Rab5-GFP (green) and (J) Rab7-GFP (green) positive puncta in both IOCs (puncta shown by yellow arrows) and photoreceptor cells (puncta shown by white arrows). (K) Vesicular Ed (red) does not colocalize with anti-Rab11 staining (green) in recycling endosomes in either IOCs (yellow arrows) or photoreceptors (white arrows).

