Fig. 5.
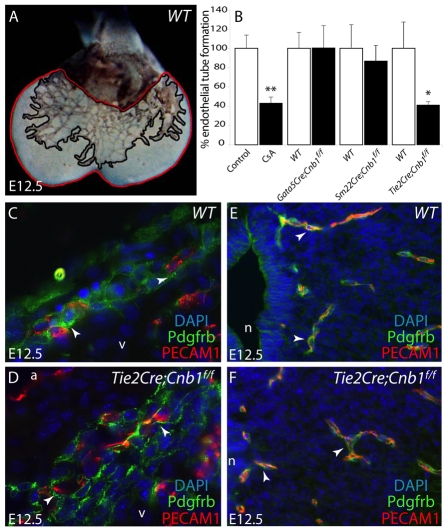
Quantitation of coronary endothelial network formation and recruitment of perivascular supporting cells. (A) Quantitation of the extent of the coronary endothelial network: the ratio between the ventricular area covered by endothelial tubes (PECAM1 staining, outlined in black) and the total ventricular area (outlined in red) was calculated for three individual hearts in each of the described groups. (B) Percentage of the ventricular area covered by endothelial cells is represented for each of the groups of embryos analyzed. Statistical significance was calculated by t-test analysis (*, P<0.05; **, P<0.01). Error bars represent the standard deviation (n=3 wild-type and CsA-treated or mutant hearts). (C,D) PECAM1 (red) and PDGFRβ (green) staining in wild-type (C) and Tie2-Cre;Cnb1f/f (D) embryos, showing recruitment of pericytes to nascent coronary vessels. Arrowheads denote coronary vessels. DAPI-labeled nuclei are blue. (E,F) PECAM1 and PDGFRβ staining indicating normal recruitment of pericytes to somatic vasculature in wild-type (E) and Tie2-Cre;Cnb1f/f (F) embryos. Arrowheads point to vessels. a, atrium; n, neural tube; v, ventricle.

