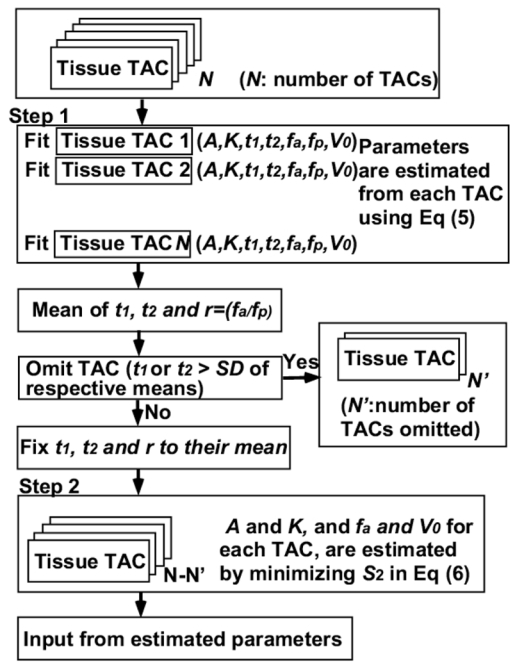
Fig 1.

A schematic diagram of the procedure to estimate the input functions using multiple tissue TACs. (Step 1) the model function (Eq (4)) was individually fitted to N tissue time activity curves (TAC). Then, means and standard deviations of t1, t2, and ra were calculated, and the tissue TACs with values of t1 or t2 > one standard deviation of respective means were excluded (indicated as N′ TACs) to avoid the potential influence of TACs outside the liver. In the second step, assuming that all parts of the liver share the same input functions, values of t1, t2, and ra were fixed to their means and the other two parameters (A and Ke(1+α)) were estimated by minimizing the Eq (6) by the grid search method. Finally, the image based input function was obtained by substituting the estimated parameters into Eq (1).
