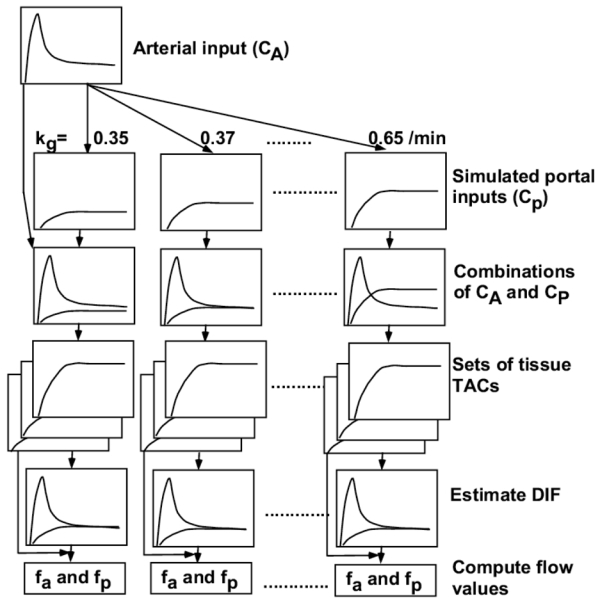
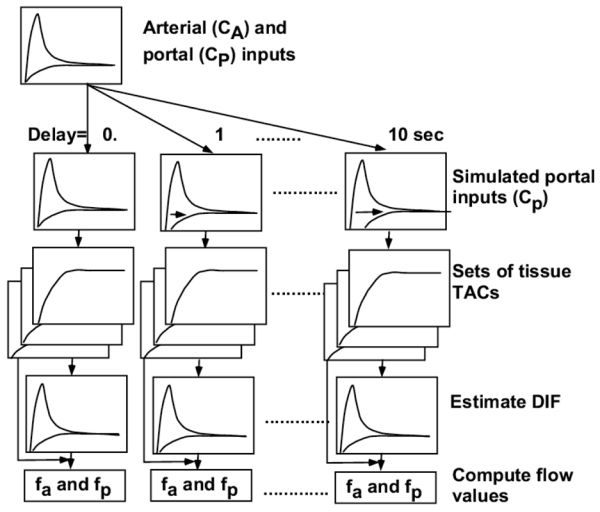
Fig 2.


Schematic diagram of the procedure to analyze error sensitivity in hepatic arterial (fa) and portal flow (fp) values against assumed kg (A) and time delay (B). Portal input curves were created by changing the value of kg from 0.35 to 0.65/min in (A) and by shifting the time from 0 to 10 sec in (B), respectively, and combinations of the arterial (CA) and simulated portal (CP) curves were used as the simulated dual input functions (DIF). Sets of tissue time acticity curves (TAC) were generated from these simulated DIFs, by assuming ten values of fa from 13 to 17 ml/min/100g. In turn, each set of tissue TACs was used to back-estimate DIF fixing kg as 0.5/min and time delay as 0.0 sec. Finally, fa and fp were calculated from estimated DIFs for each kg and delay time. TAC: time activity curve, DIF: dual input function.
