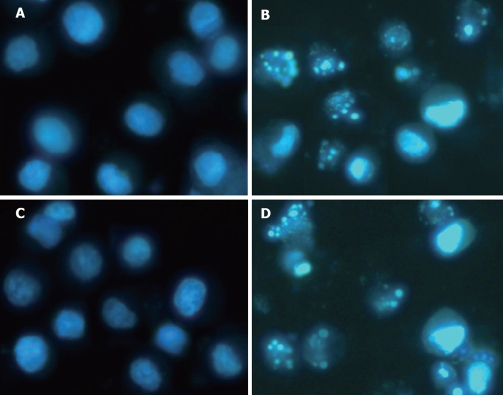
Figure 1.
TSA (37.5 ng/mL per 72 h in BGC-823 cells and 75 ng/mL per 72 h in SGC-7901 cells) induced apoptosis (Hoechst 33342 staining, × 400). A: No typical apoptotic BGC-823 cells were observed in control group; B: BGC-823 cells treated with TSA (37.5 ng/mL per 72 h) showed the typical apoptotic nuclear morphology; C: No typical apoptotic SGC-7901 cells were observed in control group; D: SGC-7901 cells treated with TSA (75 ng/mL for 72 h) showed the typical apoptotic nuclear morphology.

