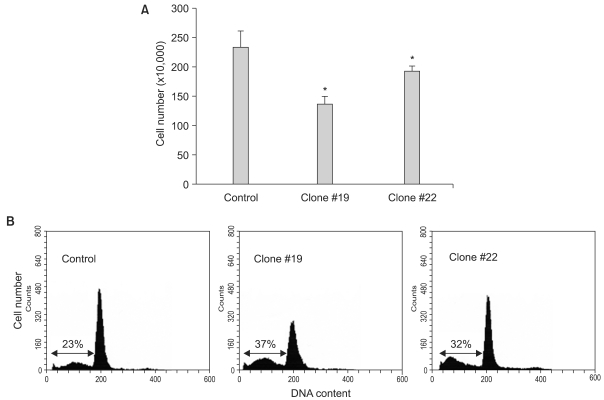
Fig. 3.
Growth suppression by DKK-1. (A) Direct counting. Values represent the means±standard error of 2 determinations per experiment from 3 independent experiments over 4 days of culture (*p<0.05 compared to the control). (B) A representative DNA histogram. Cells were stained with propidium iodide and analyzed by flow cytometry. The percentage of cells in the sub-G1 phase is shown.

