
Fig. 2.
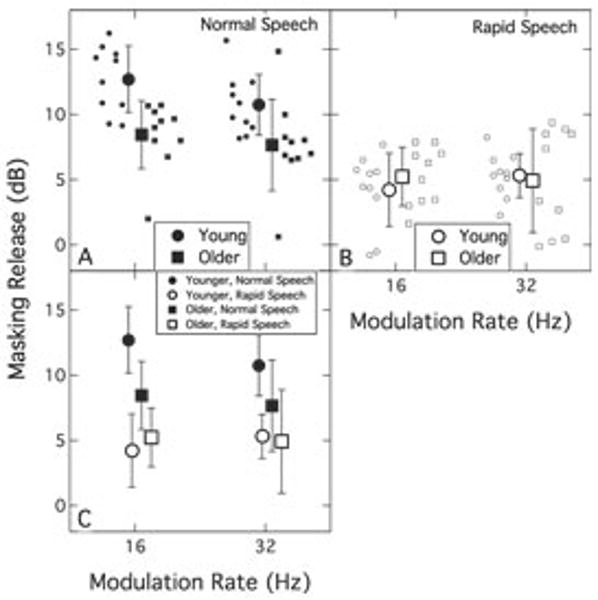
Modulation masking release plotted as a function of modulation rate. Panels A and B are individual and mean data for normal and rapid speech, respectively, for both younger (circles) and older (squares) listeners. The mean data and associated standard deviations are re-plotted for all conditions in panel C for both age groups.