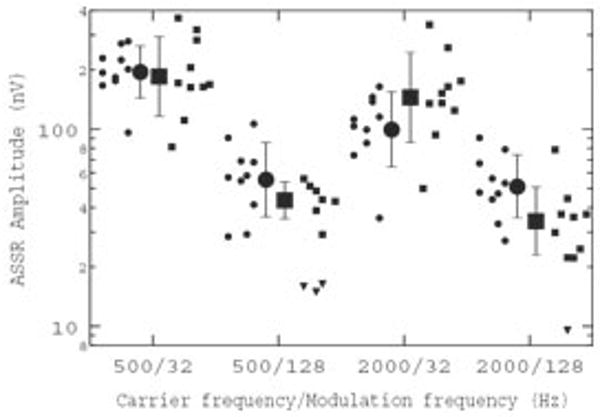
Fig. 3.

ASSR amplitude plotted for each combination of ƒc and ƒm. Mean data, with associated standard deviations, are shown as large symbols, with individual data offset to either side for younger (circles) and older (squares) listeners. For cases (n = 4) where the EEG component at ƒm = 128 Hz was not significantly different from the surrounding EEG noise, the amplitudes are identified as inverted triangles.
