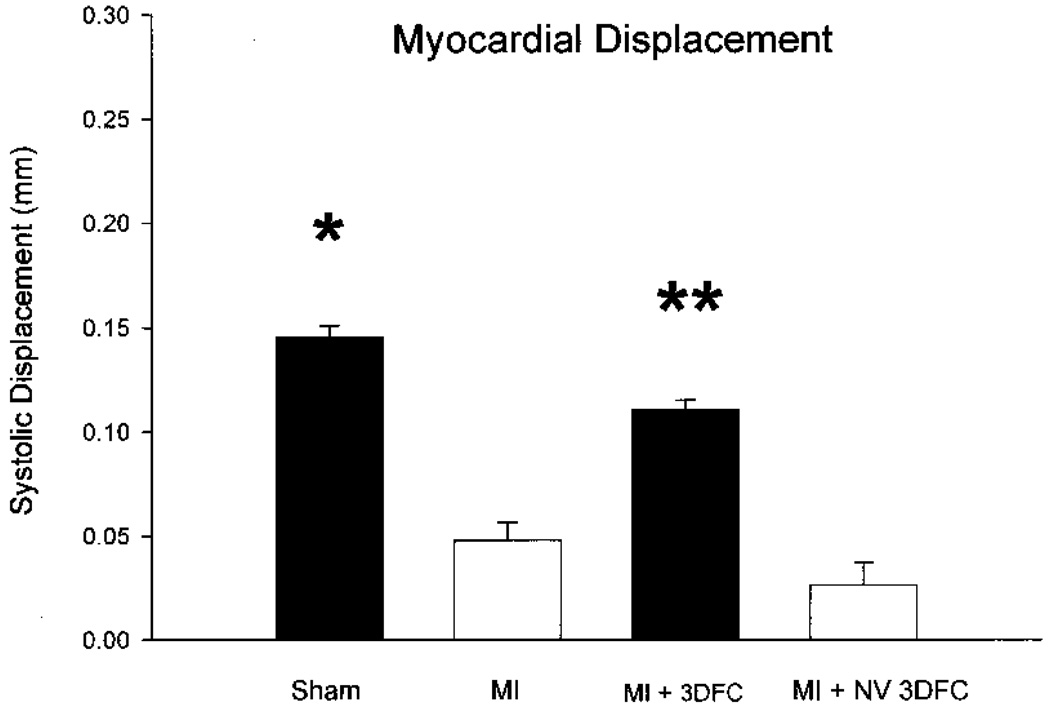
Figure 4.
Echocardiographic measured systolic displacement of the infarcted anterior wall in sham, myocardial infarction (MI), and MI + 3DFC. Note that the 3DFC improved EF back toward the normal value. Values are mean ± SE. Sham (N = 6); MI (N = 12); MI + 3DFC (N = 15); MI + NV 3DFC (N = 12). *p < 0.05 versus MI; **p < 0.05 versus MI.

