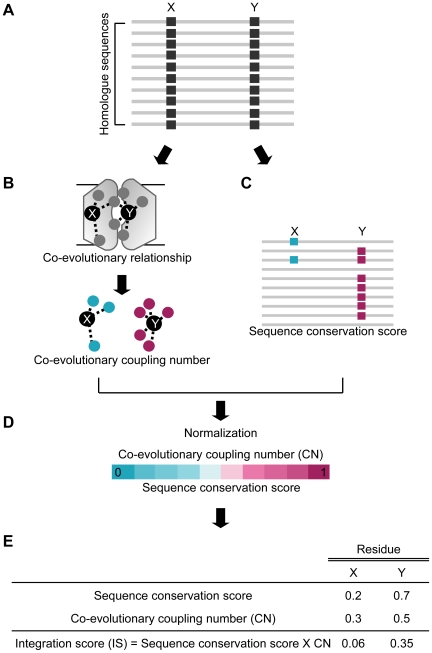
Figure 1. Overview of integrative evolutionary analysis.
(A) A schematic view of multiple sequence alignment (MSA) of a protein family. Co-evolution and sequence conservation scores were calculated from homologue sequences. X and Y indicate different residues in a protein. (B) Quantification of the co-evolutionary relationship of a single residue. Co-evolutionary coupling number (CN) was defined by the number of co-evolved residue pairs per residue. A dashed line represents co-evolving residue pairs. Circles represent the co-evolved partners of residues X and Y. (C) Measurement of sequence conservation scores of residues X and Y. Blue and red squares indicate conserved amino acids of residues X and Y, respectively. (D) Normalization of CN and sequence conservation scores by assigning a score raging from 0 to 1. (E) Integration score (IS) was obtained by multiplying CN and sequence conservation score.

