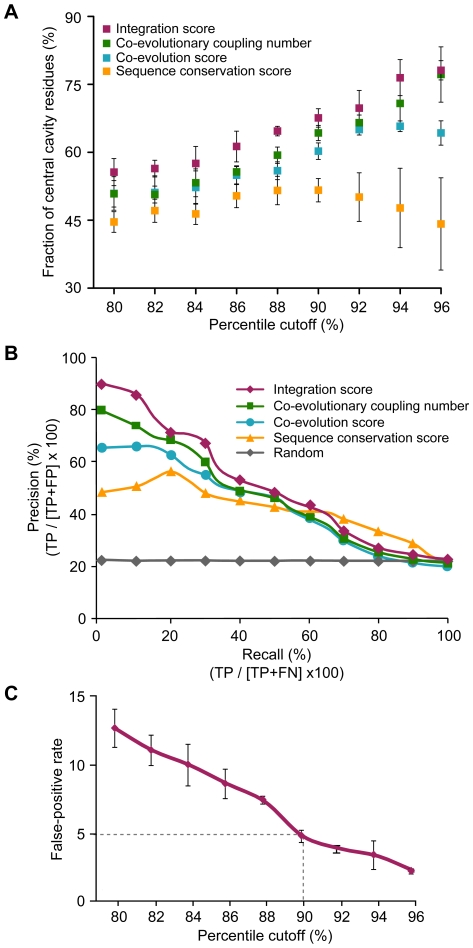
Figure 2. Performance comparisons of three evolutionary features.
(A) Fraction of central cavity residues at the given percentile of each evolutionary approach. Red, green, blue, and yellow squares indicate the average fraction of central cavity residues at the given percentile of IS, CN, co-evolution, and sequence conservation scores, respectively. Error bars indicate the standard deviation. (B) Precision-recall curves of four evolutionary approaches. Precision and recall were derived from cavity residues (positive set) and non-cavity residues (negative set) of three MFS transporters. Red, green, blue, and yellow dots represent the average precision of each evolutionary approach in the given recall. (C) Optimization of the percentile cutoff of IS. False-positive rates of IS were shown at the given percentile cutoffs. The dashed line indicates the percentile cutoff of IS with 5% false-positive rate. Error bars indicate the standard deviation between false-positive rates of three different MFS transporters.

