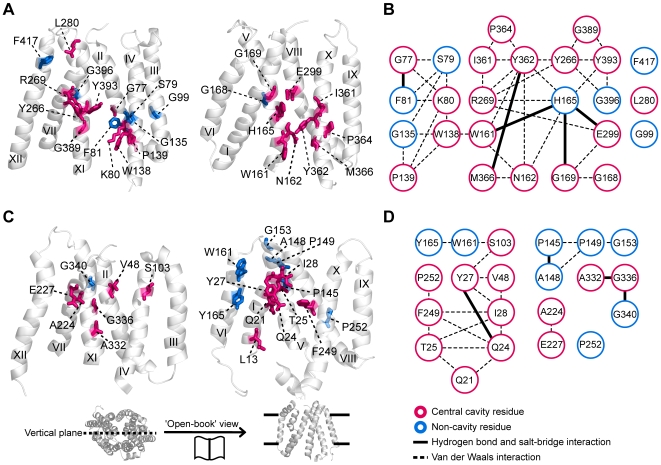
Figure 5. High-IS residues of GlpT and EmrD.
(A) ‘Open book’ view of detected residues in GlpT. Central cavity and non-cavity residue are shown in red and blue sticks, respectively. (B) Interaction network of the detected residues in GlpT. Of the 22 network comprising residues (left), 17 residues are found in central cavity (red sticks) and 5 residues are found in the non-cavity region (blue sticks). Dashed line indicates a van der Waals interaction. Bold line indicates a potential hydrogen bond or salt bridge. (C) Mapping high-IS residues onto the EmrD structure. (D) Interaction network of the detected residues of EmrD. Ten residues comprise a main interaction network (left).

