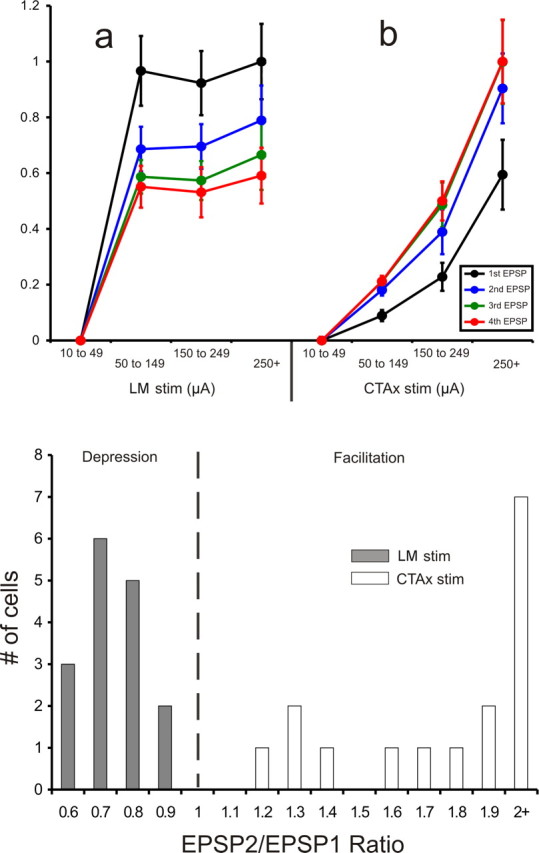
Figure 3.

Top, Normalized EPSP amplitudes recorded in AD following the stimulation of LM (a) and the corticothalamic axons (b) at different intensities. The data are plotted as a function of each EPSP (first to fourth) for each intensity bin. Stimulation of LM (n = 16) resulted in an all-or-none response pattern: once the current intensity threshold for the generation of EPSPs is reached, further increases in current intensity do not produce larger EPSPs. Contrary to that, increases in the intensity of stimulation of the corticothalamic axons (n = 16) resulted in increases in the amplitude of the EPSPs recorded in AD. Error bars represent the SEM. Bottom, Distribution of the paired-pulse effects in the two pathways plotted as the ratio of the amplitude of the second EPSP divided by the amplitude of the first EPSP, as generated at minimal stimulation intensity. The mammillothalamic synapse produced ratios of <1 (depression), while the corticothalamic synapse produced ratios of >1 (facilitation). The EPSP2/EPSP1 ratios of the two populations were significantly different (p < 0.001, t test). CTAx, Corticothalamic axons.
