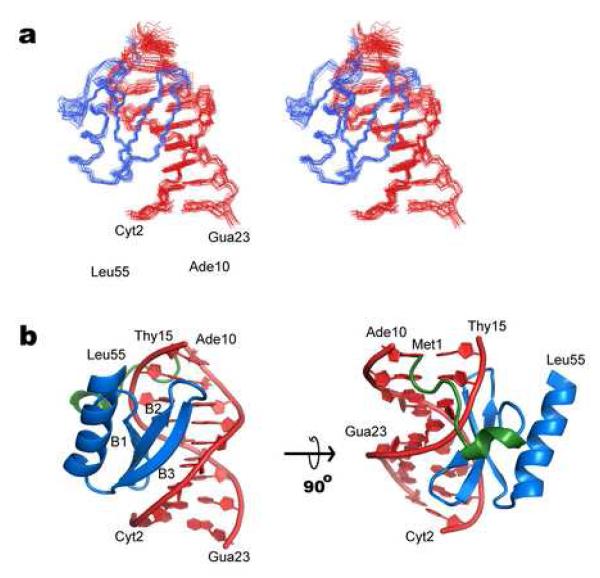
Figure 2. NMR solution structure of the IntN-DNA complex.
(a) A cross-eyed stereo view showing the ensemble of 20 lowest energy structures of the IntN-DNA complex. The protein (amino acids 1 to 55) and DNA backbone (nucleotides Cyt2 to Ade10, and Thy15 to Gua23) are shown in blue and red, respectively. (b) Ribbon drawing of the lowest energy structure of the complex. The strands in the beta-sheet and the helices are labeled. The view in the left image is identical to that shown in panel a. The amino-terminal portion of the protein that becomes ordered upon binding DNA is colored green. The solution structure of the IntN:DNA complex was determined in two stages. The structure of IntN in the complex was determined using the ATNOS/CANDID software package, which identifies NOE distance restraints by automatically assigning the NOESY NMR data 40; 41. Input spectra for the calculations included: a 3D 13C- edited NOESY spectrum recorded using the sample dissolved in 100% D2O and a 15N- edited NOESY spectrum of the sample dissolved in water. Chemical shift assignments for residues Met1-Asp11 were excluded from the ATNOS/CANDID calculations because long range NOE signals from this part of the protein were sparse and the software tended to miss-assign these signals. After seven rounds of calculations CANDID yielded a converged bundle of conformers representing the structure of IntN. In a separate set of calculations the program NIH-XPLOR was used to calculate the structure of the bound DNA molecule. Distance restraints for the DNA were obtained by manually assigning 2D F1,F2 13C filtered NOESY spectra of the complex. In addition, the structures were refined using dihedral angle restraints obtained from the program TALOS and loose DNA dihedral angle restraints for the DNA. The latter, maintained the DNA molecule in a B-form conformation and facilitated convergence, but otherwise did not alter the structure of the complex. NIH-XPLOR was then used to calculate structures of the complex 42. The structure was calculated using the previously determined structure of the DNA molecule and the protein in its unfolded state. The initial docking calculations made use of full-set of distance restraints for the DNA and protein, as well as a limited number of intermolecular NOE’s to orientate the protein and the duplex. The resultant structure was then refined in an iterative manner by manually inspecting the NMR data. During the refinement the program QUEEN was used to sort NOE restraints by decreasing information content 43. The fifty most significant restraints were checked manually and this process (restraint sorting by QUEEN and manual restraint checking) was repeated until all of the most significant restraints were correct. At the final stages of refinement intra-protein hydrogen bonds in regions of regular secondary structure were identified by inspecting NOE data for characteristic patterns. In addition to standard energy terms to maintain appropriate covalent geometry and to account for distance and dihedral angle data, a mean force potential was employed to improve the structure of the DNA molecule 33,44. The final calculations produced 200 structures, 84 of which completely satisfied the experimental data. The program MOLMOL was used to make figures for this paper45.

