
Figure 3.
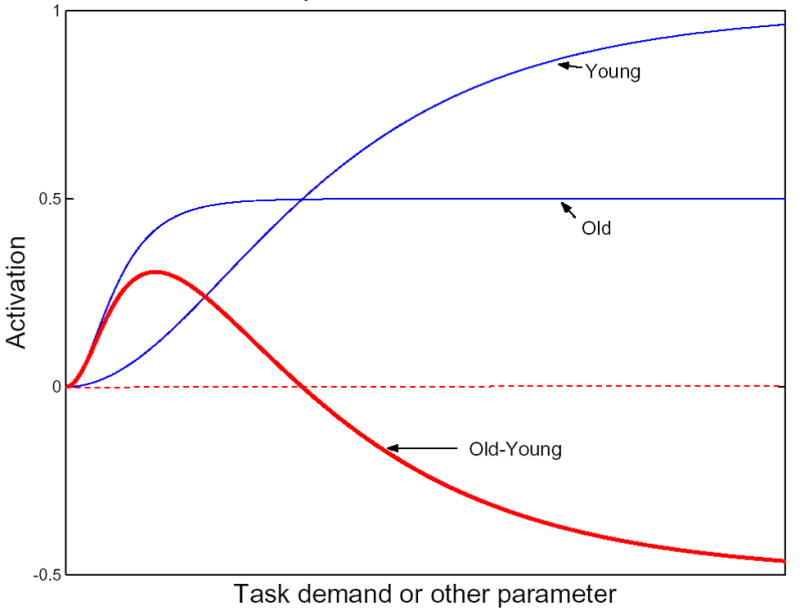
Hypothetical relationship between task demand and activation in old and young. On the X axis is increasing task demand, referring to a within-subject manipulation where the difficulty of the task is increased in a parametric manner. The Y axis represents task-related activation either at one particular brain location or throughout some brain network. The figure demonstrates hypothesized curves relating task demand to task-related activation in young and old individuals. The rate of rise in the curve is an index of the efficiency of the system. The asymptote of the curves could indicate the capacity of the system. Note in the illustration that at relatively low task demand, greater activation might be seen in old people than in young people. Conversely, at greater task demand, greater activation might be seen in the young subjects than in the old.