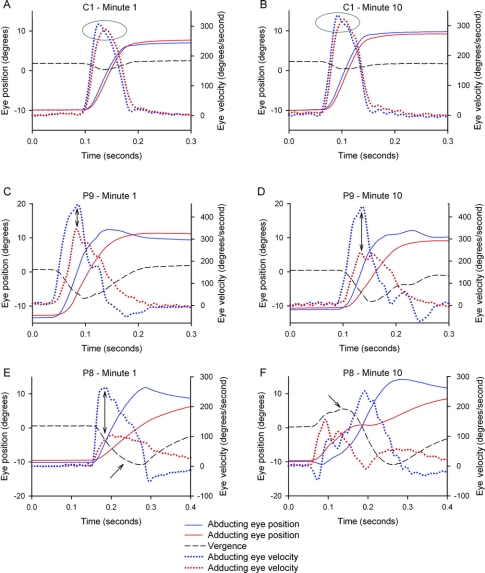
Figure 2 Representative records of horizontal saccades made during the first and 10th minute of the fatigue test for a control subject (C1) and two patients (P9 and P8)
Positive values indicate increased abduction or adduction and convergence. Note that position scales at left and velocity scales at right vary between different subjects but are constant for each subject. In A and B, the normal subject shows little difference between the peak velocities of the abducting vs adducting eyes (highlighted in ellipses) at 1 or 10 minutes; transient, minor divergence is evident. In C and D, P9 with mild INO (versional disconjugacy index [VDI] <1.9) shows greater peak velocity of the abducting vs adducting eye at 1 minute (adduction lag), and this increased further by 10 minutes (double-headed arrows); divergence is increased compared with the control subject. In E and F, P8 with more severe internuclear ophthalmoparesis (VDI >1.9) shows a large difference between the peak velocity of the abducting and adducting eye at 1 minute (double-headed arrow), which caused transient divergence (lower arrow), similar to Patient 9. However, by 10 minutes the eyes initially converge (upper arrow), so that an adduction lag is no longer evident.

