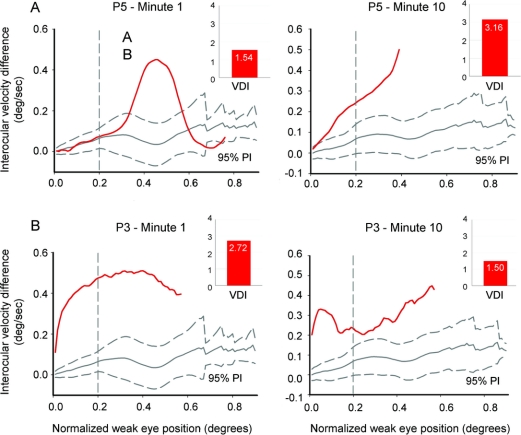
Figure 4 Phase-plane plots of velocity disconjugacy of saccades during the first minute (left plots) and during the 10th minute (right plots) of the fatigue test for representative patients P5 (A) and P3 (B)
The red curves are mean plots of velocity disconjugacy from several saccades; 95% prediction intervals (PI) for saccades from control subjects are shown in gray. The value of interocular velocity difference (IVD) corresponds to the normalized velocity difference between the eyes when normalized eye displacement reaches 0.2 (vertical dashed line). (A) Representative records from patient P5, who showed deterioration of INO (velocity disconjugacy at displacement of 0.2) at 10 minutes. A consistent change in VDI is also shown (red bars at right upper corner). (B) Example of a patient P3, whose INO improved during the fatigue test; note how the initial component is similar, but by displacement of 0.2 IVD value is reduced. Consistent change in VDI is also shown.

