Fig 3.
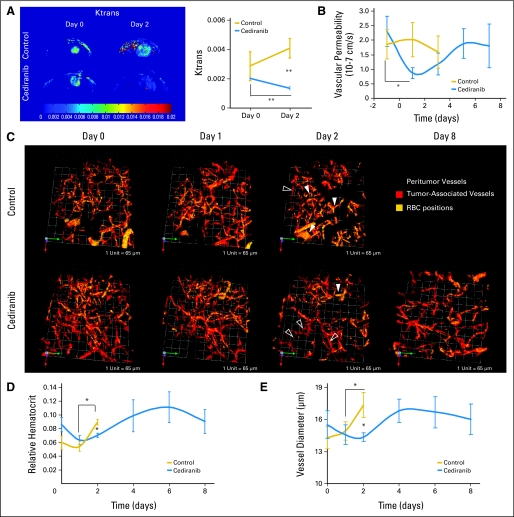
Cediranib treatment normalizes glioma vessel morphology and function. (A) Cediranib treatment (6 mg/kg each day) leads to a statistically significant decrease in Ktrans (arbitrary units, **P < .05, n = 4). (B) Cediranib significantly decreases vascular permeability measured by intravital microscopy (*P < .05, n = 12). (C) Representative multiphoton laser scanning microscopy (MPLSM) three-dimensional reconstruction of the tumor (red) and peritumor vessels (gray) superimposed with RBC positions acquired through analysis of injected fluorescently labeled RBC. Control animals have predominantly hemoconcentrated vessels (closed arrows). Cediranib-treated animals have predominantly low hematocrit vessels (open arrows). (D) Mean and SE of tumor vessel relative hematocrit measured by MPLSM. Cediranib significantly decreases relative hematocrit (*P < .05, n = 4). (E) Cediranib transiently but significantly decreases vessel diameter measured by MPLSM (*P < .05 n = 4).

