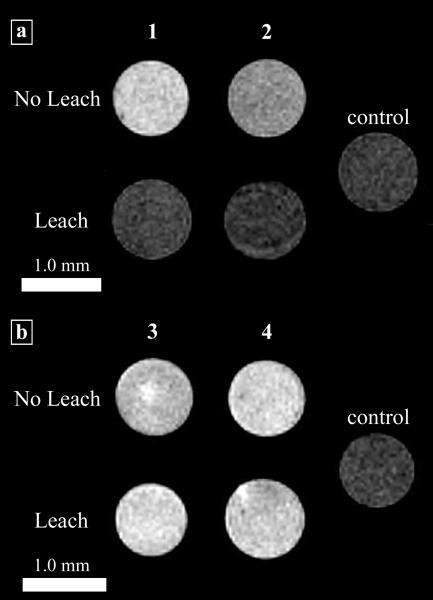
Figure 9.
T1-weighted MR images of NIH/3T3 cells incubated with complexes 1-4. The ‘No Leach’ rows are the cell populations that were not allowed to leach. The ‘Leach’ rows are the cell populations that were allowed to leach for 4 h with washes of DPBS. The control cells were not incubated with contrast agent but were harvested and packed following the same procedure. (a) Cells incubated with Gd(III)-DOTA-Arg8 or Gd(III)-DTPA-Arg8 (1 and 2). (b) Cells incubated with Gd(III)-DOTA-SS-Arg8 or Gd(III)-DTPA-SS-Arg8 (3 and 4).

