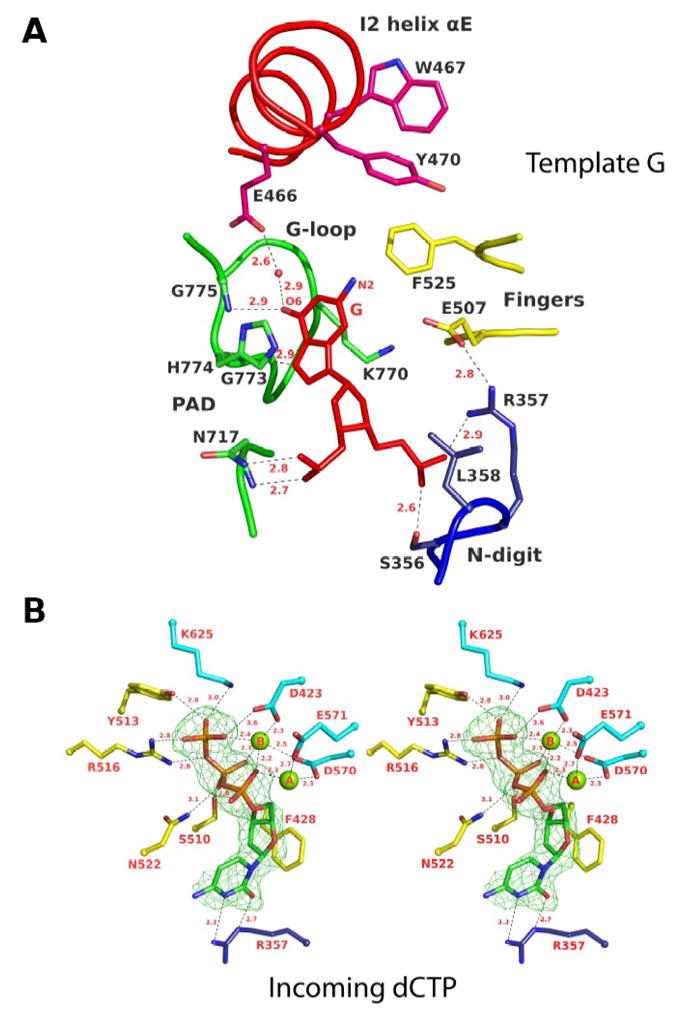
Fig. 3.

Rev1 interactions with template G and incoming dCTP. (A) A close-up view of the interaction between human Rev1 and template G. Residues are colored according to the domain or subdomain/insert they belong to (c.f. Figure 1): yellow, fingers; green, PAD; dark blue, N-digit; red, insert I2. Template G is shown in red. Hydrogen bonds are depicted as dotted lines and the distances are in Angstroms. (B) A close-up stereo view of the human Rev1 active site showing interactions with incoming dCTP. Residues are colored according to the domain they belong to: yellow, fingers; cyan, palm; dark blue, N-digit. dCTP is shown with Fo-Fc difference density (green) at a contour level of 3s. The two catalytic magnesium ions (A and B) are shown as green spheres. Distances are given in Angstroms.
