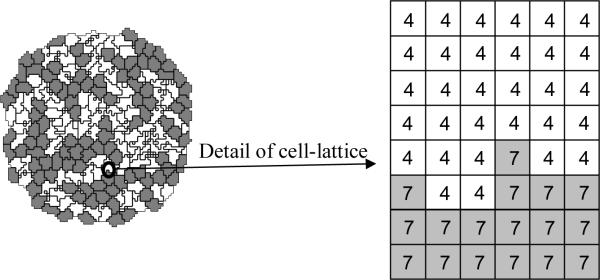
Figure 1.
Detail of a typical two-dimensional GGH cell-lattice configuration. Each colored domain represents a single spatially-extended cell. The detail shows that each generalized cell is a set of cell-lattice sites (or pixel), , with a unique index, σ , here 4 or 7. The color denotes the cell type, .

