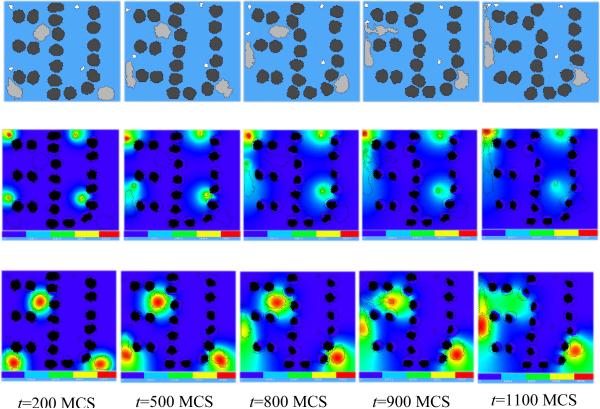
Figure 11.
Snapshots of the bacterium-and-macrophage simulation from Listing 4 and the PIF in Listing 6 saved in the file `bacterium_macrophage_2D_wall_v3.pif'. The upper row shows the cell-lattice configuration with the Macrophages in grey, Bacteria in white, red blood cells in dark grey and Medium in blue. Middle row shows the concentration of the chemoattractant ATTR secreted by the Bacteria. The bottom row shows the concentration of the chemorepellant REPL secreted by the Macrophages. The bars at the bottom of the field images show the concentration scales (blue, low concentration, red, high concentration).

