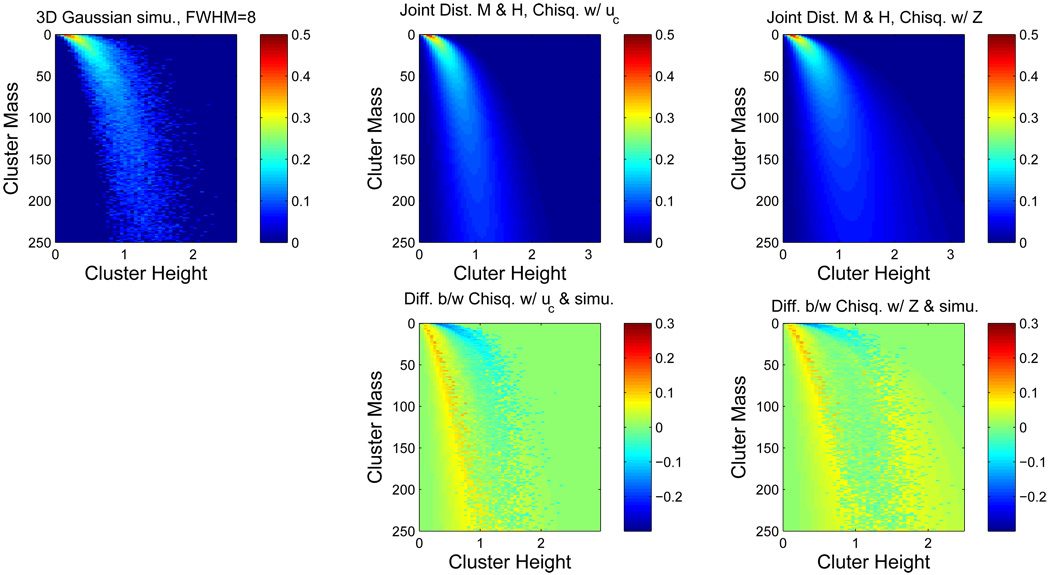
Figure 1.
Comparison of true and theoretical joint distributions of cluster mass and peak height intensity, for Gaussian images. On top left is the true distribution obtained from simulation, on the top middle is the 𝒰 result and on the top right is the Ƶ result. Below each of the theoretical results is the true minus estimated distributions. While only an intermediate result, the agreement is reasonable, with better performance obtained with the Ƶ result. All distributions are transformed by the fourth root to improve visualization. Unless otherwise noted, simulation settings used in the figures are: uc = 2.3263 (p=0.01), 64 × 64 × 30 image at FWHM 8 voxels.

