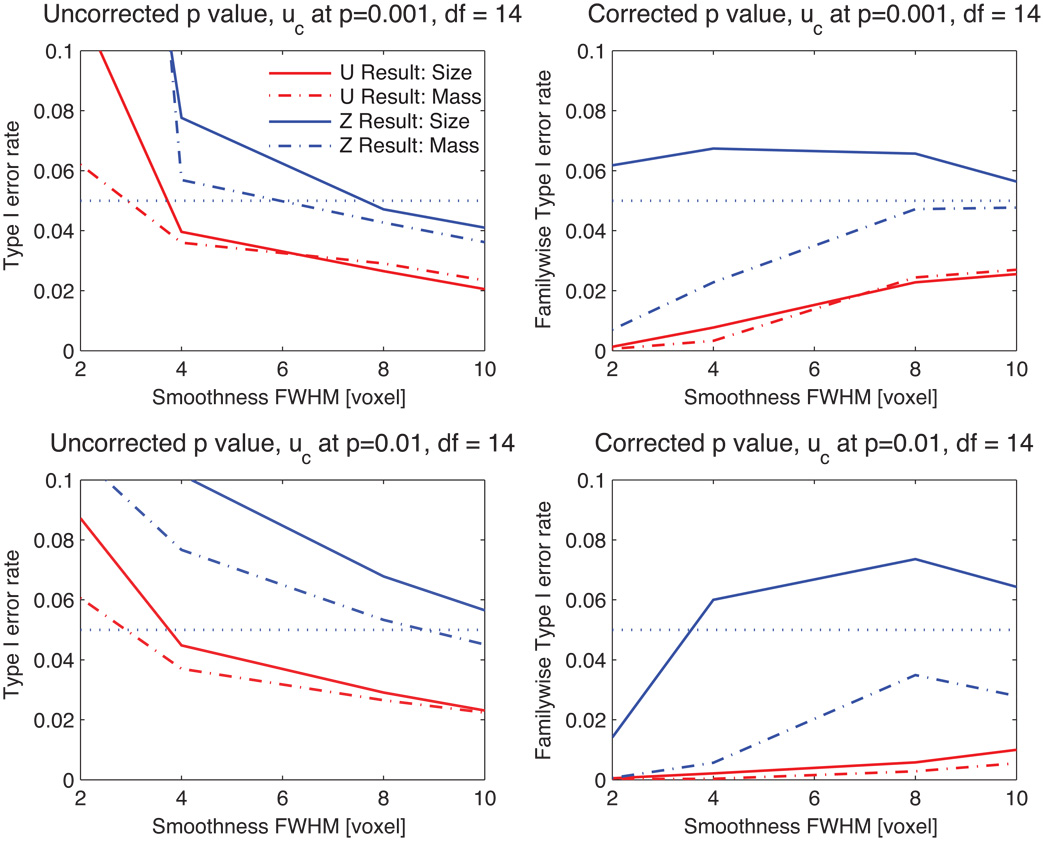
Figure 5.
Type I error rate for Gaussianized t images, for both P = 0.01 and P = 0.001 cluster-forming thresholds, with different smoothness. While uncorrected P-values perform poorly under low smoothness, our Ƶ cluster mass method has the corrected P-values are closest to the nominal α = 0.05 level without being invalid.

