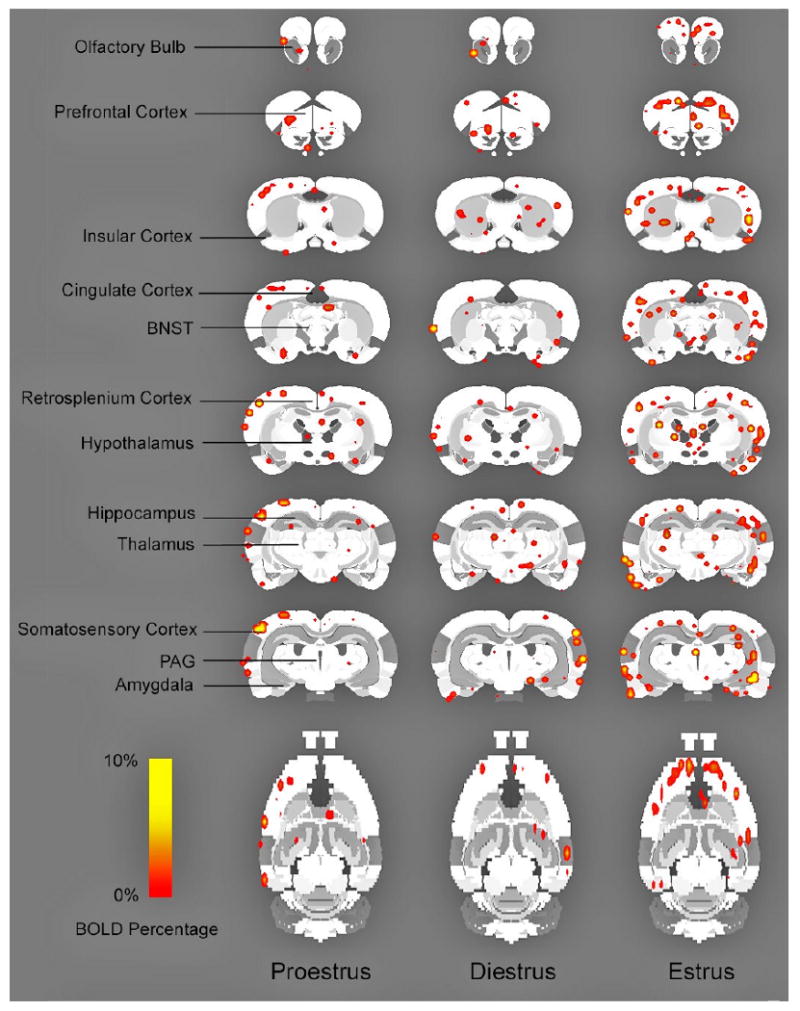
Figure 2. TMT-elicited brain activation maps (2D) of positive BOLD signal response across the estrus cycle.

Each subject was registered or aligned to a fully segmented rat brain atlas using MIVA (Medical Image Visualization and Analysis). Activated voxels (based on a t-test, thresholded at p <0.05) are overlaid onto the corresponding segmented atlas (2D).
