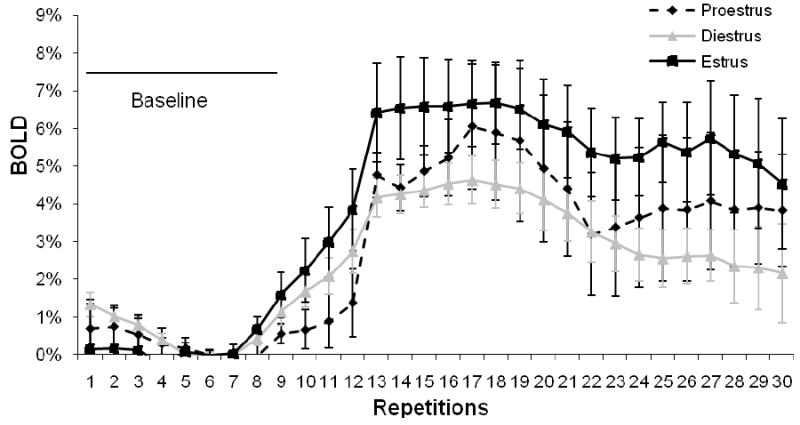
Figure 5. Time course showing signal change across estrus phases for the olfactory cortex.

Error bars represent SEM. This figure demonstrates that there were no significant differences (p>0.05) in BOLD response during baseline imaging where no scent was presented.
