Fig. 2.
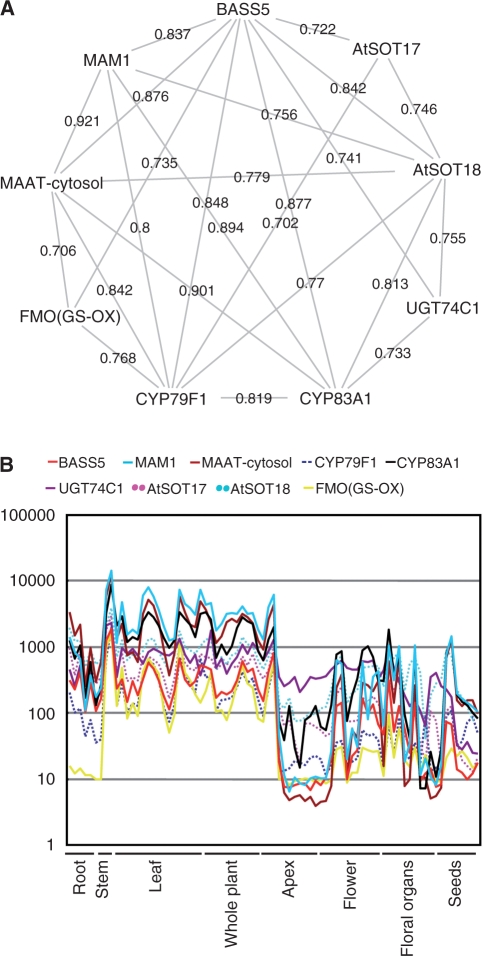
Expression pattern of Met-GSL biosynthesis genes. (A) The co-expression relationship of BASS5 with Met-GSL biosynthesis genes. Pearson’s correlation coefficients between gene pairs are shown on the edges. Only the genes connected directly to BASS5 were shown in the network (see Materials and Methods). (B) Developmental expression pattern of the genes shown in (A). The figure was illustrated by AtGenExpress Visualization Tool (http://jsp.weigelworld.org/expviz/expviz.jsp).

