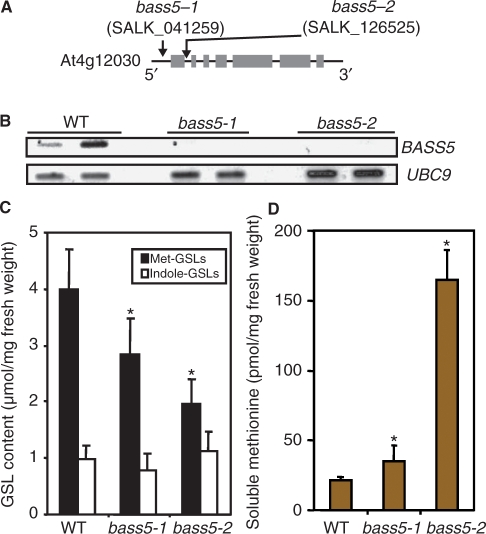
Fig. 3.
Effects of BASS5 knockout on the metabolite accumulation pattern. (A) Diagrams of the BASS5 gene with exons shown as gray boxes. The arrows indicate the T-DNA insertion sites. (B) Expression levels of BASS5 examined by RT–PCR using duplicate samples. UBC9 was used as the control. (C, D) The contents of GSLs (C) and methionine (D) in the leaves of bass5. The mean and standard deviation (n = 6) are shown. Asterisks indicate a statistically significant change compared with wild-type (WT) plants by Welch’s t-test (P < 0.05).

