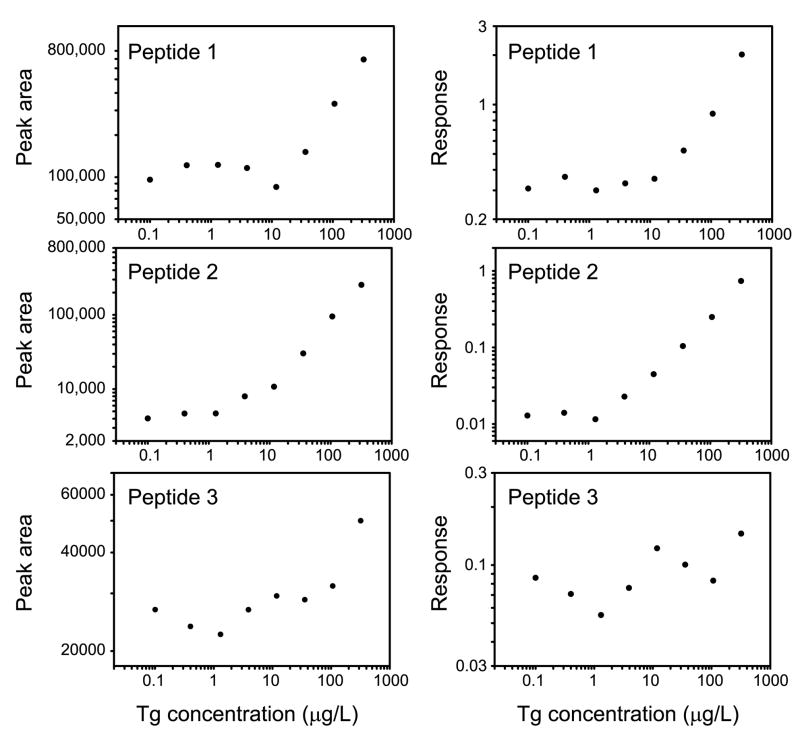
Figure 3. LC-MS/MS response of endogenous thyroglobulin peptides vs. concentration.
Shown are the ion current peak areas (left panels) and responses (peak area of endogenous/peak area internal standard peptide, right panels) for each peptide detected in a dilution series of a human serum sample containing 319 μg/LTg. The internal standard peptide is chemically identical to Peptide 1 and differs only in mass.

