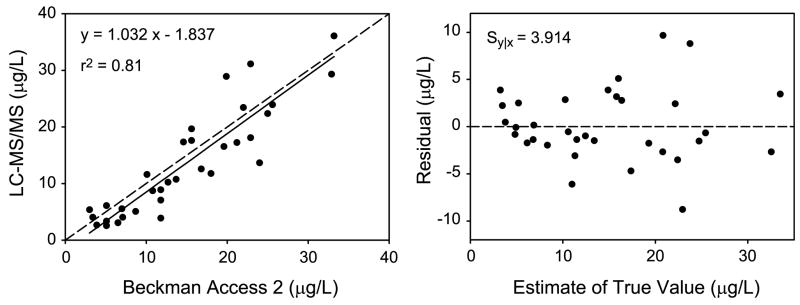
Figure 4. Correlation of Tg quantification by immunoaffinity enrichment-LC-MS/MS and an immunoassay.
Results using immunoaffinity purification of peptides from tryptic digests with external calibration were compared with a standard clinical immunoassay for Tg in serum (left). The Deming regression equation (Analyse-It; Leeds, England, UK) is shown with the Pearson correlation coefficient (r2). The residuals of each data point from the regression line are also shown (right) with the standard error of the residuals (Sy|x). The estimate of the true value was calculated using the ratio of the standard deviations of each method with Analyse-It.

