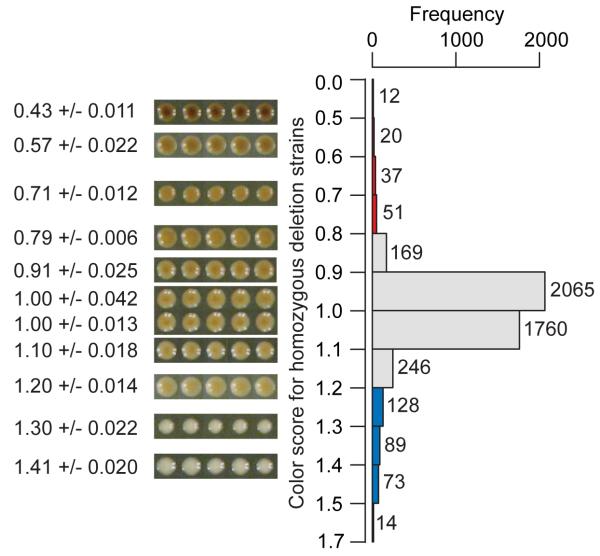
Fig. 2.
Phenotypic distribution of enhancers and suppressors of rust coloration in the homozygous yeast deletion collection. Rust coloration was measured by the average intensity of the green channel from RGB photographs of a strain divided by the median of all strains in the same row or column (See methods for details). Enhancers are shown in red and suppressors in blue. Photographs of selected strains show five replicates per strain illustrating the mean and standard deviation of the rust coloration phenotype.

