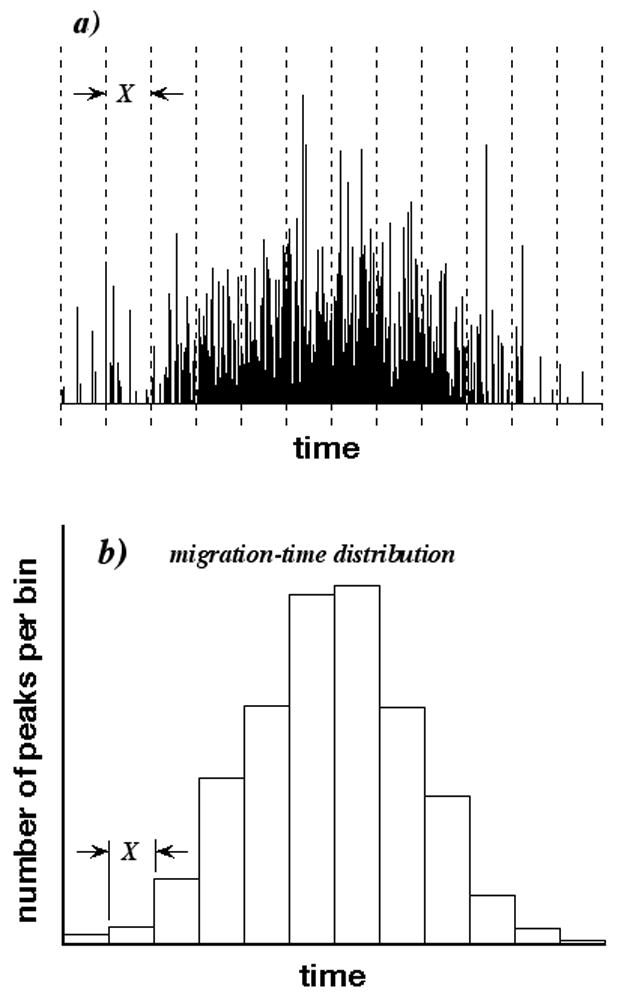
Figure 1.

a) Simulated organelle CE containing 1000 peaks and 812 observed peaks (maxima). CE is partitioned into 12 bins having duration X and represented by dashed lines. b) Migration-time distribution of CE determined by counting peak numbers in different bins.
