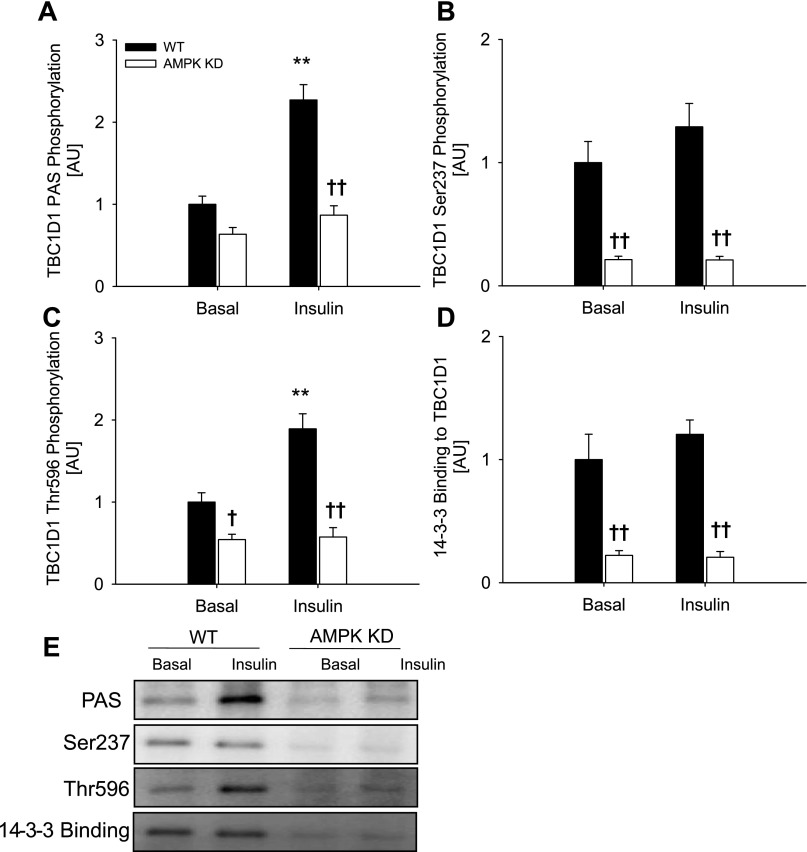
Fig. 4.
TBC1D1 phosphorylation and 14-3-3 binding in response to insulin in WT (filled bars) and AMPK KD mice (open bars) and representative blots. TBC1D1 PAS phosphorylation (A), Ser237 phosphorylation (B), Thr596 phosphorylation (C), and 14-3-3 binding capacity (D) in EDL muscle from WT and AMPK KD mice in response to insulin. E: representative blots using corresponding antibodies. Data are related to WT basal and expressed as means ± SE; n = 7. **Difference between basal and insulin-stimulated muscle P < 0.01; †/††difference between WT and AMPK KD mice P < 0.05/0.01.

