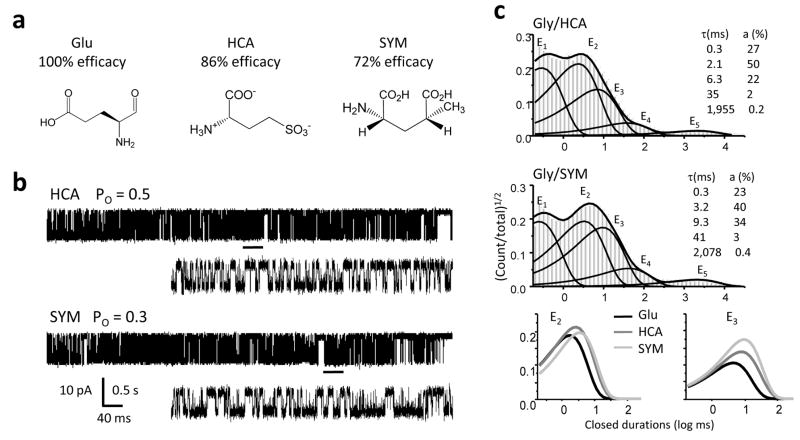
Figure 2. NMDA receptor activities with GluN2A partial agonists.
a, Chemical structures of the ligands used, with reported efficacies34.b, Representative single-channel traces (10 s, shown filtered at 1 kHz with openings down) obtained with glycine and the partial agonists indicated. Underlined portion (500 ms) of each record is shown below filtered at 12 kHz and higher resolution. c, Histograms of closed interval distributions for a record in each condition (events: HCA, 137,512; SYM, 226,688) superimposed with the probability density function (thick lines) and exponential components (E1 – E5, thin lines) estimated from fits of a 5C4O state model to the idealized data. Insets show time constants and areas for the corresponding exponential components in the file shown. Bottom panel singles out the E2 and E3 components of the distributions shown above.

