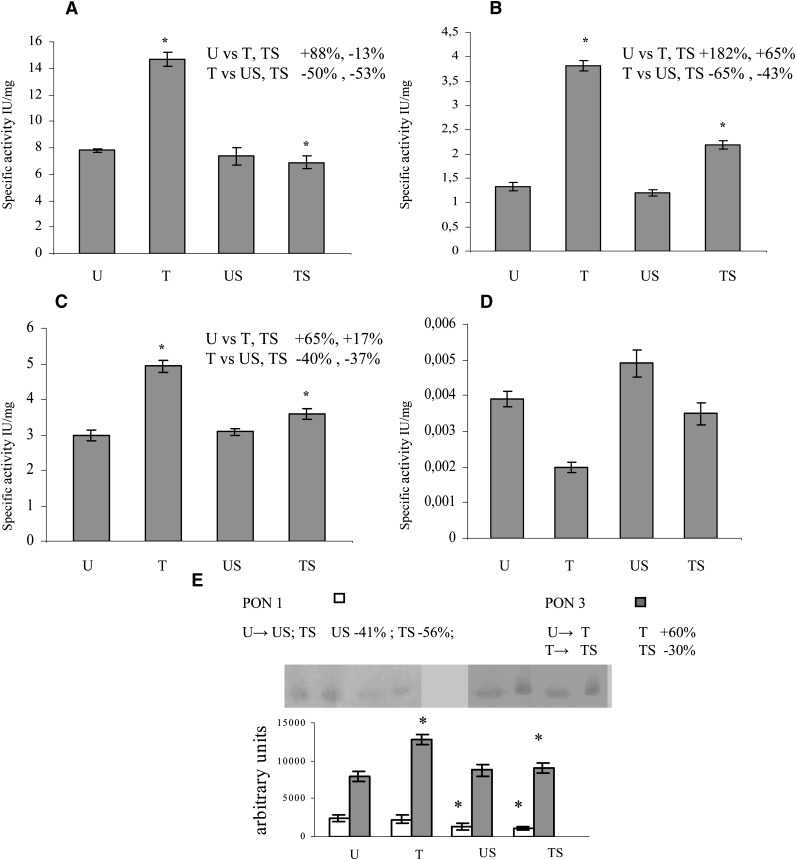
Fig. 2.
PON expression in plasma. Activity assays were performed in quadruplicate with four different substrates. All samples were incubated at room temperature for 2 hr with PMSF (2 mM final concentration) before the assays, in order to inhibit CEs. (A: phenyl acetate; B: DHC; C: 2-coumaranone; D: paraoxon). The specific activity is given as mean value ± SD. Western blotting analysis was performed in triplicate (E). Data represent the mean value ± SD of multiple evaluations expressed in arbitrary units after analysis by Scion Image for Windows. Panel inserts show immunostaining image for PON1 or PON3. Statistical analysis was performed using one-way ANOVA and Fisher s LSD Test. * P ≤ 0.05 versus the other groups are reported in each insert.

